Just How Easy is it to Manipulate a Survey?
Posted: 14/06/2015

We demonstrate that people’s survey responses are highly unstable. By running two identical surveys, but changing the earlier questions, we find significant shifts in their subsequent responses. Accordingly, we question the value of traditional self-report surveys.
Hypnotist Paul McKenna, Jack Daniels whisky, and existential French philosophy – all things that you can be under the influence of, albeit only for a limited period of time. Or, to take another example, think of a number between 0 and 100. Now estimate the proportion of UN countries that are located in Africa. In this celebrated experiment people who generated higher or lower numbers responded, on average, 45% or 25% respectively1. A clearly unrelated random number doubled their subsequent answer.
We are nothing if not impressionable creatures. It is simply an unappealing fact that we are always under the temporary influence of the last thing we saw, heard or did. And it is particularly dispiriting if you design research for a living. You just couldn’t get an academic paper published in psychology if the findings were potentially an unintended consequence of the research design. Yet traditional market research firms seem oblivious to this problem. Just how wrong are they? How much does design influence their findings?
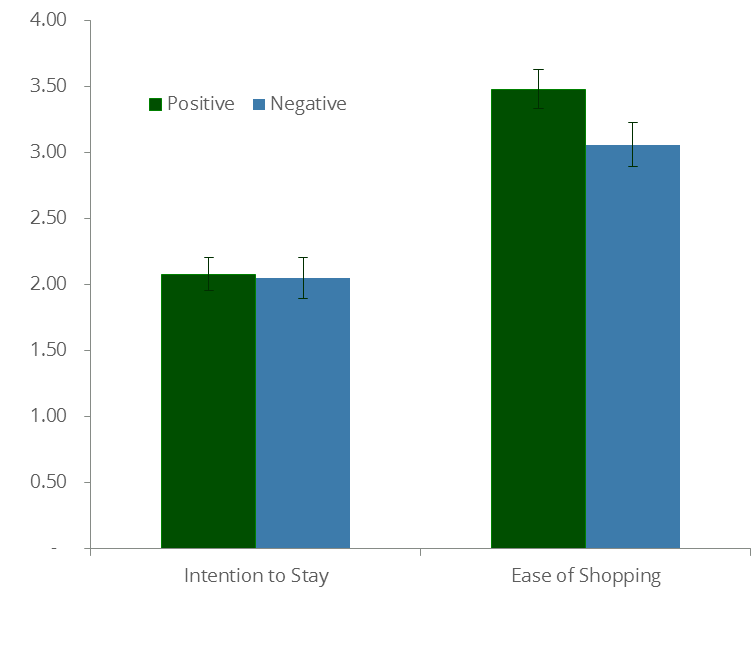
To examine this question we ran two parallel surveys. Both surveys asked people their likelihood to switch energy supplier over the next 12 months and how easy they thought it was going to be to find the right deal. And, before that, both surveys asked people a seven item inventory about the last time they shopped for an energy tariff2. But in one survey this prior shopping inventory was positively framed (e.g. “it was easy to compare tariffs”) and in the other negatively (e.g. “it was difficult to compare tariffs”).
Effect on Subsequent Questions

The graphic shows the average ratings of the subsequent questions across the surveys. There are two main findings. First, asking people what they liked about the last time they shopped around, rather than what they disliked, has a dramatic impact on reported future ease3. Between the two frames there’s a 0.42 swing in the rating, which is both statistically significant and a huge shift for a seven point scale.
Second, the same effect isn’t observed for intention-to-switch. Perceived ease of switching is more malleable. Why? Perceptions are generally more speculative than behaviours and therefore more prone to manipulation – something we’ll return to. Furthermore, the preceding question related directly to the search process. There will be other, un-manipulated, switching drivers that add to the stability of the intention-to-switch question.
Both these findings demonstrate the importance of ensuring that research is thoughtfully designed. Only then will it yield replicable, relevant, transferable insights. Conversely, it’s pointless to research people with tasks that are either so unnatural as to be meaningless or so superficial as to be completely malleable. This is not, therefore, just a question of better craftsmanship. It’s a question about whether such a survey is worth running in the first place. As a French existentialist would almost certainly have said, ”traditional surveys are nothing else but that which they make themselves.”
1. Tversky, A. & Kahneman, D. (1974). Judgement under Uncertainty: Heuristics and Biases. Science, 185 (4157),1124–1131. The actual proportion is 54 out of 193 or 28%
2. Specifically, in the negative frame, “What if anything did you dislike about the task of shopping around (check all that apply)” followed by seven options such as “It took too much effort”, “It took too long”, and so on.
3. If you want to see another example of the same effect, watch Yes, Prime Minister’s “Leading Questions” here.