U.S. Presidential Election Forecast
Posted: 04/11/2024

Summary
- Voter Preference: Inflation and Abortion Rights lead voter concerns, with a well-defined distinction between the platforms on Abortion but no clear winner on Inflation.
- Polling Errors: US Presidential eve polls have historically been +/-3.2% different to the popular vote. Partly because people don’t know or won’t say how they will vote.
- Outcome Forecast: Our modelling of shy voters predicts a +1.6% swing towards Harris and therefore a 68.7% chance that she will win.
The 60th US Presidential election will be held on 5th Nov 2024 and, as things stand, it’s on a knife-edge. Polls have Harris leading by +1.2%. Based on that lead forecasters give her around a 50% chance of winning1. You can win the popular vote and lose the election, as Clinton did in 2016. Meanwhile, betting and financial markets favour Trump, pricing a Harris win at around 45%. Who is right? To model this election and make our own predictions, we’ve undertaken fieldwork in eleven swing states2. This report details those results.
Election Landscape
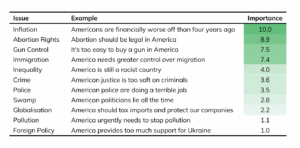
First, to understand the election landscape, we measured the issues that are driving people’s choices and how the candidates are performing against these voter concerns. To characterise this election, voters recorded how strongly they agree or disagree with forty different problem statements, such as “It’s too easy to buy a gun in America”. These were then aggregated into the eleven election issues shown in Figure 1.
Figure 1: Election Issues
Source: Dectech Research, October 2024 (N = 945)
It’s an interesting side note that agreement or disagreement with these issues is now so tribal that a confirmatory factor analysis reveals just one dimension in this data, maybe two at a pinch. This contrasts with the voter ideology literature which has expanded on the traditional left-right characterisation, albeit in countries where there are more political parties (e.g. the Netherlands3). It seems like the political system itself shapes the complexity of the debate and thereby the resultant polarity.
Figure 1 also shows how important these issues are to voters. Importance is measured as the absolute deviation in voter opinions on a 1-10 scale. In other words how strongly do people feel about an issue, regardless of whether that’s for or against. All the voters agree that Inflation and Abortion Rights are key issues. But Republicans and Democrats take different positions on Abortion whilst agreeing that Inflation is a big problem, even as they disagree on the solution.
Voter Preferences
Figure 2 then contrasts how important an issue is for voters with how differentiated the candidate platforms are on that issue, again on a 1-10 scale. As noted, everyone agrees that Inflation is important. But the candidates’ policies and messaging aren’t distinctive. Neither candidate has made a sufficiently persuasive case that they are differentially attracting voters who are worried about inflation.
Figure 2: Candidate Choice Drivers
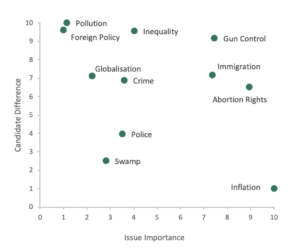
Source: Dectech Research (Oct 2024, N = 945). Swing state voters responded to various statements regarding importance of societal issues using a seven-point response scale, from “Strongly Disagree” to “Strongly Agree”.
The opposite is true for Pollution, Foreign Policy, Inequality and Gun Control. A given voter’s opinion on these issues is extremely predictive of how they will vote. Harris clearly intends to introduce restrictions on gun ownership where she can and vice versa. Likewise, Harris would supply more arms to Ukraine and seek a ceasefire in Gaza. Trump’s position is the opposite. But those foreign policies, alongside the environment and protectionism, just aren’t that important to most voters.
Polling Error
Given these issues and the candidates’ policy positions, who’s going to win? As noted earlier, the polls have both candidates nearly tied based on hundreds of surveys involving hundreds of thousands of voters. Most of these surveys are independent, though some are partisan attempts to influence the election momentum. The independent ones focus on minimising sample bias, re-weighting responses to reflect predicted turnout, modelling the resultant data to project county level results and so forth. Multilevel regression with poststratification is certainly impressive stuff.
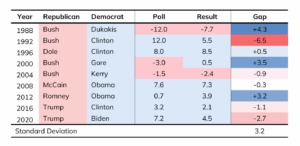
Figure 3: Prior Errors
Sources: RealClearPolling.com and Wikipedia.org
And yet, as is well documented, polls are frequently wrong. There’s been a string of examples this year including the French, Indian and Japanese parliamentary elections. Likewise, Figure 3 shows the polling error in prior US Presidential elections. The table compares the average election eve lead of the Democrat over the Republican with the actual next day popular vote. In 2020 Biden had a +7.2% poll lead over Trump going into the election. The actual result was much closer, with just a +4.5% lead in the popular vote, giving a 2.7% overnight swing in Trump’s favour.
Swing Prediction
The past experience shows that these polls tend to be out by ±3.2% and there’s no obvious improvement over time. This kind of swing would change this election. What’s causing these movements and can they be anticipated? It’s now traditional that, after every major polling miss, there’s some kind of industry sponsored independent enquiry (c.f. the UK General Election in 2015). These almost always conclude that there was a sampling or weighting problem. The polling process had somehow missed a group of voters that proved important or focused too heavily on some other.
Whilst this is doubtless part of the explanation, it’s also recognised that some of the shift comes from the elicitation method. Many voters either don’t know or won’t tell the pollster how they are going to vote. At Dectech, we’ve spent over twenty years trying to forecast how people will behave. Over time we’ve learned not to rely on either their introspection or their self-report. Instead, we’ve developed other methods for measuring their motives and predicting their choices. For example, we use revealed preference experiments or model real-world behaviour.
To forecast this Presidential election we used various techniques, including an adapted version of Unmatched Count4. This method was originally developed to anonymise responses in sexual behaviour research. Our conclusion is that polls are under-estimating Harris by +1.6%. This is a bold claim. Trump delivered swings against the Democrats of -1.1% and -2.7% in the last two elections. That he would now suffer a +1.6% swing against him is fighting talk. But that’s what the data says.
Swing Causes
As discussed, part of these overnight swings are generated by the competing forces of people not wanting to say that they’re going to vote for Trump (or wanting to boast about voting for Harris) “Shy Trumpers” and vice versa “Shy Harrisers”. There’s lots of reasons why you might want to be one of these voters. For example social embarrassment, desire to conform, strategic responding and so forth. Many of those reasons go away once you anonymise responses.
So the +1.6% is an aggregate outcome across voters. There are both Shy Harrisers and Shy Trumpers out there, just there’s more of the former. And this varies across the population. Men are more likely to say they’re voting for Trump even if they won’t. They show a +3.7% swing towards Harris. Women have more Shy Trumpers, though this effect is muted, with a -1.4% swing away. Likewise, we measure more Shy Harrisers amongst Black voters and vice versa for Church goers – it’s hard to say you’ll vote for a convicted criminal, but you still want to stop abortion.
However, the main driver of our finding is turnout. The Shy Trumpers are less likely to vote. The fact they can’t even bring themselves to say they’ll vote for him is also an incentive to stay home. Conversely, the Shy Harrisers are more likely to vote. They feel they have to say they’ll vote Trump but inside they believe he must be stopped. In that sense, it looks like a repeat of the 2024 French parliamentary election where voter opposition united to thwart the far-right Rassemblement National candidates.
Election Forecast
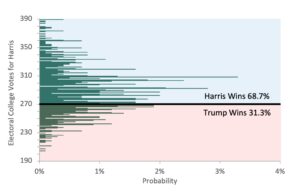
So, what does a +1.6% over night swing to Harris mean? We applied this increase, together with a ±2.1% unanticipated swing, to State-level polls plus some additional idiosyncratic local voting behaviour. Using Monte Carlo simulation, we then calculated the Electoral College votes associated with thousands of scenarios. Figure 4 shows that outcome distribution. In contrast to other predictions, we estimate the probability of Harris winning at 68.7%. Her expected Electoral College votes are 289, just nineteen more than the 270 required for a majority.
Figure 4: Probability Distribution of Electoral College Votes for Harris
Source: Dectech Forecasts 2024
Clearly there is lots of uncertainty around these forecasts. Some of that uncertainty is already included in this distribution. For example, there’s a 43.7% chance of the Electoral College vote falling within 20 of the 270 majority, inevitably leading to recounts and leaving the election undecided for many weeks. Likewise, our forecast still gives Trump a 31.3% chance of winning. We are not saying Harris will win. As applied statisticians we do find ourselves endlessly reminding people that events with a 31.3% probability of happening do happen. About 31.3% of the time, in fact.
The central thesis here, that this time the election popular vote will swing in Harris’ favour, rather than Trump’s, is the key unknown. This is what our data shows. We can fit a narrative to the underlying details. These methods have worked well when we’ve tested them before. However, without that assumption, the outcome is nearer 50% and, if you assume Trump can replicate his prior election swings, nearer the probabilities priced into the markets. Only one thing is certain. We will eventually know who won and, by implication, the forecasters who were either wrong or, of course, unlucky.
Issue Date: Final Forecast November 4, 2024
-
Polling figures reflect aggregated data from New York Times, The Times & The Economist polls.
-
The fieldwork evaluated 945 voters who are resident in Arizona, Florida, Georgia, Michigan, Minnesota, Nevada, New Hampshire, North Carolina, Pennsylvania, Texas or Wisconsin.
-
Laméris, M. D., Jong-A-Pin, R., & Garretsen, H. (2018). On The Measurement of Voter Ideology. European Journal of Political Economy, 55, 417-432.
-
Raghavarao, D., & Federer, W. T. (1979). Block Total Response as an Alternative to the Randomized Response Method in Surveys. Journal of the Royal Statistical Society. Series B (Methodological), 41(1), 40–45.